2019

Using Salesforce with Pentaho Data Integration

Pentaho Data Integration is the tool of the trade to move data between systems, and it doesn’t have to be just a business intelligence process. We can actually use it as an agile tool for point-to-point integration between systems. PDI has its own Salesforce input step which makes it a good candidate for integration.

What is Salesforce?

Salesforce is a cloud solution for customer relationship management (CRM). As a next generation multi-tenant Platform as a Service (PaaS), its unique infrastructure enables you to focus your efforts where they are most essential: creating microservices that can be leveraged in innovative applications and really speeding up the CRM development process.

Salesforce is the right platform to give you a complete 360º vision of your customer and his interactions with your brand, whether this happens via your email campaigns, call centres, social networks, or a simple phone call. Marketing automation is, for example, just one of the many great things Salesforce brings to you in an all-in-one platform.

How do we use PDI to connect to Salesforce?

For this access we need all our Salesforce connection details: the username, password and the SOAP web service URL. PDI has to be compatible with the SOAP API version that you use. For example:

  PDI version   SOAP API version number
  2.0   1.0
  3.8   20.0
  4.2   21.0
  6.0   24.0
  7.0   37.0
  8.2   40.0


Nevertheless, even if Salesforce gives us a new version of the API we can still use the old API perfectly well. Just be careful, because if you’ve created new modules inside the platform, the new API won’t have these customisations, and so you’ll need to use the Salesforce Object Query Language (SOQL) to get the data. But don’t worry, we’ll explain it all in the next section.

How do we use PDI to connect to Salesforce?

The SOQL syntax is quite similar to SQL syntax, but with a few differences:

  1. The SOQL does not recognise any special characters (such as * or ; ) and so we have to use all the fields that we will get from Salesforce, and we cannot add the ; at EOF.
  2. We cannot use comments in a query; SOQL does not recognise this either.
  3. To create joins we need to know a few things:
    • For the native modules that we need linkage to (direct relationship), we need to add in final name a ‘s’. For example:

Get all Orders with and without has Products (OrderItem Module)

  • For the customisation modules that we need to get data from another module (direct relationship) we need add to final name the  ‘__r’ . For example:
    Filter  OrderItems by Product_Skins__c field inside Product 2 Module 

How do we extract data from Salesforce with PDI?

We can use the Salesforce input step inside PDI to get data from Salesforce using SOQL; just be aware you can only use up to 20,000 characters to create the query.

  • Connection parameters specified:
    • Salesforce web service URL:

<url of Salesforce Platform>/services/Soap/u/<number of API Soap updated>

  • Username: Username Access to the Platform  (i.e. myname@pentaho.com)
  • Password:Password + Token (the company provides the token for us add to the password in Kettle.Properties) i.e: PASSWORDTOKEN

Settings parameters specified:

    • Specify query: Without active (like we can see in the image below) we only need to choose the module (the table containing records that we need to access).

For the next tab (Content) we have the following parameters options:

  • If we want to get all records from Salesforce (I mean, if we want to get delete records and insert records) you need place a tick in Query All Records, and choose from the parameters below one of the following options:
    • All (get new/update records and delete records), Update (get only inserts and update records) ;
    • If you untick the tick from Query All Records parameters, we only get insert/update registers;
    • Delete (we get only delete records).

How does PDI know if records are new/updates or deletes?

The Salesforce has native fields very useful for controlling the process. However we cannot see these fields in layout or on builder schema in SF. We only can see the data associated with these specific fields if we’re using the SOQL or PDI to access these fields.

  • CreatedById and CreateDate are fields that shows the user and data time when records were created.
  • The LastModifiedDate and LastModifiedID shows the data time and the user who modified the record. We can use these fields to get data updated in SF.
  • Id (Salesforce Id) present in URL as a string of 18 characters (Java config.) displays the register.
    For example:
  • We have more one native field IsDeleted with data type = Boolean that shows if the record was removed (IsDelete = true) or not (IsDelete = false).

In Additional field option we have three options:

  • Time out is useful in asynchrony systems because we can configure the timeout interval in milliseconds before the step times out;
  • Use Compression is useful to get more performance from the process. Because when you tick it, the system will direct all calls to the API and send all in .qzip field;
  • Limit is for configuring the maximum number of records to retrieve from the query.

Inside the last tab, we can see all fields from the query inside the first tab. Without SOQL we get all the module fields. With SOQL we get all the fields inside on SELECT function.

And for these cases, we need to do the manually changes.
For more details:

The base64 displays images or PDFs present in SF.

If we need send images (.jpeg) or pdf (.pdf) directly to SF we load these type of fields  using JAVA to convert binary files to the base64.

For example, to send a PDF file to SF:

How to load data to Salesforce with PDI?

Send data to Salesforce from other databases or from Salesforce.

The connection option is equal as described in Salesforce Input.
In Settings Options we have new parameters:

  • Rollback all Changes on error – if we got any error nothing will integrate into SF;
  • Batch Size – we can bring a static number of the records and integrate them simultaneously (the same batch) to SF;
  • In Output Fields Label we need to add the field name that we want to get the Salesforce ID for each record integrated.

In the Fields Option, we need to put field mapping.

  • For Module Field, we need to put the API Name field in SF to get the new data;
  • In the Steam Field, we need to put the name of the field that will be integrated into the respective field in SF;
  • Use External id = N to all field updated inside the respective Module;
  • Use External id = Y to all records that we need updating but are not present in the current module, but present in another module.

Delete records inside Salesforce

We delete records from Salesforce with Delete Salesforce step. We need to specify the key field from Table Input that does the reference to the key in Salesforce (Saleforce Id).

Update Salesforce records

If we only want to update records in SF we need to use the Salesforce Update Step.
Inside Fields (Key included) Option we need to add the key to records for the specific module.

Upsert data to Salesforce

If we want to insert and update in the same Batch to SF, we need to use Salesforce Upsert.
The parameter Upsert Comparison Field helps match the data in SF.

Fátima MirandaUsing Salesforce with Pentaho Data Integration
read more

Meetup Data Science Hands-on by Lisbon Kaggle: hot topics

Data Science Hands-on: “Predicting movies’ worldwide revenue”

On May 4th, a day known worldwide as Star Wars Day (“May the fourth“), approximately 40 Data Science fans seized this occasion to learn more about this subject by practicing and sharing on yet another Lisbon Kaggle Meetup. The “Data Science Hands-on” Meetup took place at Instituto Superior Técnico (IST Campus) and it was precisely dedicated to cinema:

  • the problem addressed consisted in predicting movies’ revenue before their premiere!

This event was also sponsored by Xpand IT, in collaboration with Hackerschool Lisboa, a group of IST students interested in technology, who also evangelizes the practice of learn-by-doing.

First off, the event started with a presentation by Xpand IT’s own Ricardo Pires, who introduced the company and their units focused on data treatment and exploration. Participants received a sample of how these problems fit in a real-world context. Shortly after, professor Rui Henriques, who teaches Data Science at IST, explained his perspective on how to approach a Data Science problem, providing some tips related to the meetup’s challenge.

Data from this challenge leverage learning and provide an idea of a potentially real problem, as they are semi-structured and demand a great amount of effort to process.

An estimated 80% of Data Scientists’ daily work revolves around data treatment.

(Source: Forbes

After the two presentations, participants started to unravel the mysteries hidden within the data. They verified, for example, a generalized increase in revenue over the years. They also noticed that American movies had a superior revenue, compared to all the rest.

Tackling the challenge

On the first part, participants modelled the problem with simpler columns, structured as:

  • budget
  • popularity
  • runtime
  • data

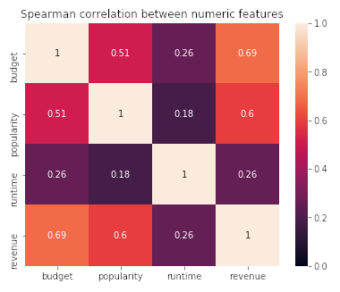
By doing so, they’ve tried to obtain the first predictions for the movies’ revenue. On the image below, which represents Spearman’s rank correlation coefficient, we can verify that budget and popularity columns are the most correlated with revenue.

During the second phase, contestants tackled the semi-structured columns, applying the one-hot encoding technique, as:

  • director
  • cast

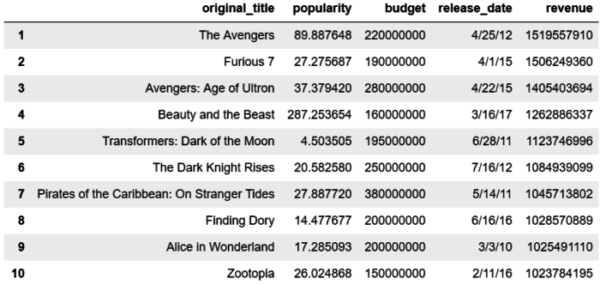
Through this deeper analysis of the data, teams found out that the movies that generated more revenue (see table below).

Other relevant aspect to consider is that popularity is not always directly related with revenue, such is the case with “Transformers: Dark of the Moon”, as it is represented as less popular, but with a high revenue nonetheless.

It is also interesting to observe the actors who generated more revenue on average:

Conclusions

At the end of the meetup, participants shared their implemented solutions:

  • The group with the best results applied Logistic Regression. Despite being a simple model, it can provide adequate results when the focus is data treatment.
  • Data treatment went through several techniques, such as detection of outliers, in movies with a very discrepant budget, replacing these values with the median.
  • Budget and revenue columns were transformed into their respective logarithm, in order to approximate them to a Gaussian distribution.
  • One of the advantages of using a simpler model is that these are also easier to explain to a business stakeholder.

The fourth of May was spent learning alongside the most wonderful people, enlightening in every way. In case you’re interested in Data Science, join the community and show up at our monthly events.

More information on the “Data Science Hands-on” Meetup.

Joana Pinto

Data Scientist, Xpand IT

Alexandre Gomes

Data Scientist, Xpand IT

Sara GodinhoMeetup Data Science Hands-on by Lisbon Kaggle: hot topics
read more

Bootstrap: Introduction to the world’s most popular CSS library

Bootstrap is the most popular HTML, CSS and JavaScript based framework for developing responsive, mobile-first websites.

With the successive growth of mobile devices in the world, it is becoming clearer that having a responsive website is a must, and by taking a mobile-first approach, this framework has been revealed as an indispensable tool and became more popular year after year, mostly because of its feature-rich nature and ease of use. One of the most essential aspects of this framework, which represents the foundation on which to build an organised, structured layout, is its grid. Bootstrap is built on a powerful 12-Column Grid System, which allows developers to arrange and align content in a fully customisable, responsive grid. The grid adjusts according to the device resolution or viewport size, making the website content interactable and pleasant for both mobile and desktop users.

Beyond this, Bootstrap offers a base style for most HTML elements, making the website look more polished, as well as an extensive list of pre-built, fully-responsive components that are easy to integrate and customise. In terms of customisation, Bootstrap lets you change the base style, including fonts, colours and sizes, as well as modifying the existing breakpoints used in grid layout by overriding the existing CSS rules with custom ones according to the project design.

For those who prefer to build a responsive website from scratch, without the assistance of any 3rd party libraries, and who use ready-made CSS code and components from previous projects to achieve this, or who may tend to have a more conservative approach towards accepting its framework features, Bootstrap can also offer great benefits.

So, what are these benefits of Bootstrap?

Well, where you have a project with a tight schedule and with multiple developers involved, Bootstrap offers consistency between projects and people (it represents a commonly known technology) as well as speed in development, thanks to its pre-styled classes, which require much less effort and time than when creating everything from scratch. It´s important to mention that Bootstrap has good cross-browser compatibility, being currently compatible with all the latest major browsers (Chrome, Firefox, Safari, Microsoft Edge and Internet Explorer 10+) and excellent support, thanks to the huge community behind it. And, most importantly, it´s completely free and open-source. Before looking at some examples, let´s see how easy is to get started with Bootstrap.

Keep reading
Diogo CardanteBootstrap: Introduction to the world’s most popular CSS library
read more

Practical guide to installing Kotlin

Time passes by and the programming language Kotlin has more and more fans, especially when we talk about Android programming. However, Kotlin is not limited to Android mobile apps development. It is either a programming language for the JVM or a programming language for the Browser or Native, without having to run in a virtual machine.

Kotlin is 100% interoperable with Java, which allows you to add code in Kotlin to a project that has been started in Java.

One of the great advantages of this language is the absence of NullPointerExceptions.

In a direct comparison with Java, it is possible to create the same classes using fewer lines of code.

If you were convinced by all of these arguments, or if you got curious about this language, download a quick guide on how to install Kotlin and plus some basic concepts.

Download kotlin installation guide

If you want to know more about the Kotlin programming language, we recommend reading this blog post: Kotlin and a brighter future.

Bruno AzevedoPractical guide to installing Kotlin
read more

Advanced Analytics: learn how to elevate data analysis to a whole new level

Implementing a business intelligence model requires more than just gathering data; overall, it’s really about converting big data and valuable insights to add value to the business. However, if there’s no model available that allows you to analyse and understand this incoming data, all you’ll get is meaningless numbers with no added value.

In order to perform a correct data analysis, it is necessary to understand that there’s no unique valid method of analysis; the process depends on needs and requirements and the type of data collected in order to determine the most suitable analysis methodology.

However, there are some methods common to most advanced analytics that are capable of turning data into added valu, even when there aren’t established business rules, transforming data agglomerates into relevant insights, beneficial to the business and enabling well-founded decision-making.

Quantitative data and qualitative data

Before covering the various methods, let’s identify the precise type of data you want to analyse. For quantitative data, the focus is on raw number quantity, as the name suggests. Examples of this type of data include sales figures, marketing data, payroll data, revenue and expenses, etc. Basically, all the figures that are quantifiable and objectively measured.

Qualitative data, on the other hand, is fundamentally harder to interpret, considering its lack of structure, more subjective and of an interpretive nature. At this end of the spectrum you can find examples such as collected information from surveys or polls, employee interviews, customer satisfaction questionnaires and so on.

Measuring quantitative data

Looking at the analysis of quantitative data, there are four methods capable of taking that very same analysis to the next level.

  1. Regression analysis

The choice of the best type of statistics will always depend on the main goal of the research.

Regression analysis is capable of modelling the correlation between a dependent variable and one or more independent variables. In data mining, this technique is implemented to predict values on a particular dataset. For example, it can be used to foresee the price of a certain product, while considering other variables. It can also be useful to identify trends and correlations between different factors.

Regression is one of the commonest methods of data analysis in the market for management purposes, marketing planning, financial forecast and much more.

  1. Hypothesis testing/significance testing

This method, also called “T-testing”, is capable of determining if a certain premise is true for the relevant dataset. In data analysis and statistics, only a statistically significant result would be considered from a certain hypothesis, resultant of a non-random occurrence. This procedure makes predictions regarding a certain quantity of interests present in a certain population, from a studied sample, using the theory of probability.

  1. Monte Carlo simulation

One of the most popular methods for calculating the effect of unpredictable variables from a specific factor involves Monte Carlo simulations, using probability modelling to defend against risk and uncertainty. To test a scenario or hypothesis, this simulation uses random numbers and data to simulate a variety of possible outcomes. This tool is frequently used for project management, finance, engineering and logistics, amongst other areas. By testing a wide variety of hypothesis, it is possible do discover how a series of random variables can affect plans and projects.

  1. Artificial neural networks

This computational model replicates the human central nervous system (in this case, the brain), allowing the machine to learn by observing data (so-called ‘machine learning’). This type of information processing replicates the neural networks, using a model of biological inspiration to process information and learn through analysis, simultaneously performing predictions. In this model, the algorithms are based on sample inputs, while applying inductive reasoning – extracting rules and patterns from large sets of data.

Sílvia RaposoAdvanced Analytics: learn how to elevate data analysis to a whole new level
read more

5 Business Intelligence books you have to read

At Xpand IT, we believe that business intelligence goes way beyond reports and dashboards. We are expert providers of BI solutions, developing projects with the ever-present goal of adding value to any business. Many companies have already placed their bets on data analysis software, recognising the huge potential that such insights represent to progress. However, there is still a small percentage of companies unable to recognise the proper value of internal data analyses and which, therefore, choose not to provide them to their clients. And so, we’ve picked 5 great business intelligence books for you to read, to help you discover more about adopting a complete BI strategy suited to your own situation. In this digital era, we’ve chosen physical formats to help you understand modern BI strategies that you can implement, going way beyond the standard pattern.

As stated by John Owen: “Data is what you need to do analytics. Information is what you need to do business.”

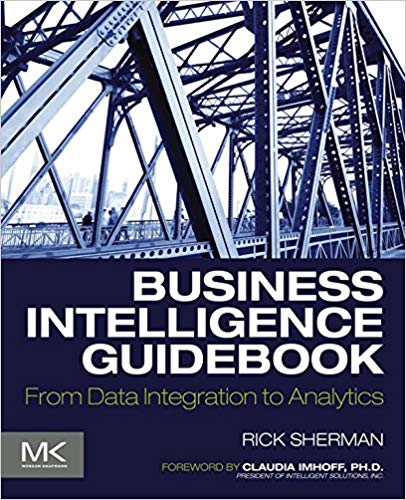
1. Business Intelligence Guidebook: From Data Integration to Analytics

1st Edition, November 2014

This is one of the more comprehensive books about business intelligence and data integration, touching on simple topics as well as vastly more complex architecture. The author guarantees that after reading this book you will be able to develop a BI project, launch it, manage it, and deliver it on time and to a budget. You will also be able to implement a complete strategy for your company – supported by the tools he introduces.

If you’re looking for a reliable source of information, capable of explaining the best practices, the best approaches, and presenting a complete overview of the entire life cycle of a BI project, adaptable for companies of any size, don’t look any further: this is the right book for you.

2. Data Strategy: How to Profit from a World of Big Data, Analytics and the Internet of Things

Bernard Marr – 1st Edition, April 2017

The author starts from the premise that less than 0.5% of all generated data is currently being analysed and used, building a compelling narrative to convince company leaders to invest in business intelligence strategies, focusing on the benefits for business growth.

Complemented with case studies and real examples, this book explains how to translate the data generated by companies into insights to support the strategic decision-making process. This aims to improve companies’ business practices and performance, with a vital combination of Big Data, Analytics and Internet of Things.

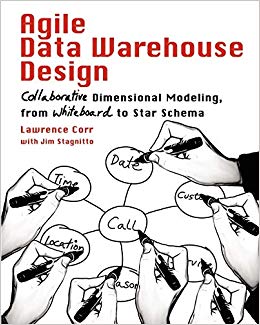
3. Agile Data Warehouse Design: Collaborative Dimensional Modeling, from Whiteboard to Star Schema

Lawrence Corr and Jim Stagnitto – 1st Edition, November 2011

This is a book for professionals looking to implement data warehousing and business intelligence requirements, turning them into dimensional models, with the help of BEAM (Business Event Analysis & Modeling) – an agile methodology for dimensional models that aims to improve communication between data warehouse designers, BI stakeholders and their development teams.

If you want to implement this methodology in your company or if you’re just curious about this approach, we strongly recommend you to explore this book, which includes, amongst other topics, subjects such as data modelling, visual modelling and data stories, using the 7 Ws (who, what, when, how many, why and how).

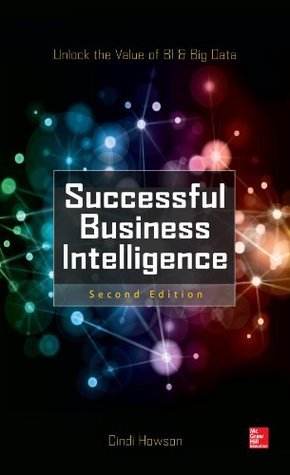
4. Successful Business Intelligence: Unlock the Value of BI & Big Data

Cindi Howson – 2nd Edition, November 2013

This is not the most recent edition, but the wealth of information it contains still makes it one of the best must-have business intelligence books you can read. The author, Research Vice President at Gartner and BI analyst, has conducted a study with the objective of identifying analytics strategies implemented by some of the biggest players in the market.

This book provides much more than just theory. It is a valuable manual that tells stories and lays out successful BI approaches, explaining why the strategies implemented cannot be the same for every company. Additionally, the book includes tips on how to achieve an adequate alignment between a company’s BI strategy and its commercial objectives.

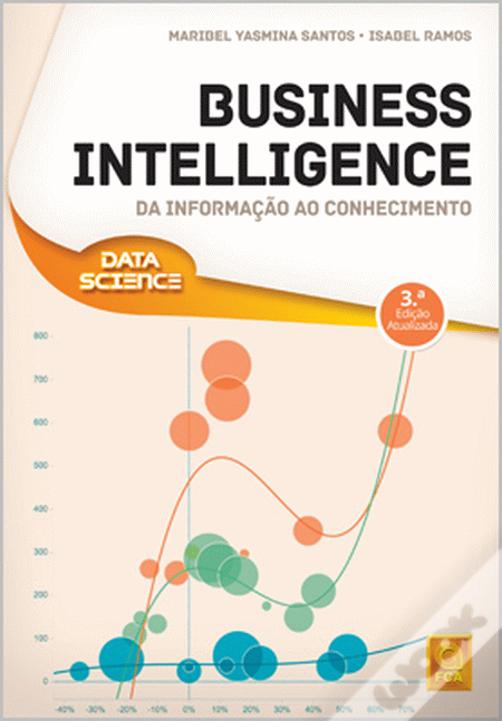
5. Business Intelligence – Da Informação ao Conhecimento

Maribel Yasmina Santos and Isabel Ramos – 3rd Edition, September 2017

This is the only Portuguese book on our list, and it’s very comprehensive, explaining the basic concepts of data analysis and demonstrating how BI technologies can be implemented – from the data warehouse storage process to the analysis of the data (online analytical processing and data mining), outlining how the resulting knowledge can be used by companies to support decision-making.

An essential book, whether you’re a professional searching for a complementary source of information or you’re simply looking for reasons to implement a business intelligence strategy in your company

If you would like to know more about some of the topics mentioned above, or if you want to implement your own BI strategy, get in touch with us today!

Ana Lamelas5 Business Intelligence books you have to read
read more

ITIL: sound practices to improve your IT service management

ITIL is an acronym for Information Technology Infrastructure Library, a set of good practices designed to facilitate a significant improvement to the operation and management of all the IT services within a company. When implemented by an organisation, this set of practices becomes an unequivocally beneficial asset, as it comes with several advantages, such as the improvement of risk management, the strengthening of client relationships, an increase in productivity and reduced costs.

Developed in 1980 by the Central Computer and Telecommunications Agency (CCTA) – a British government agency – it is the primary framework for sound IT Service Management (ITSM). It began with more than 30 books comprising numerous sources of information, and describing good practices to follow in relation to IT services. Currently, ITIL runs to 5 books covering its various processes and functions (and a total of 26 processes that can be adopted by companies).

In 2005 the framework was finally formally recognised and given the ISO/IEC 20000 Service Management seal of approval for compliance with desired standards, and for being truly aligned with Information Technology best practice.

ITIL went through various revisions and there are now 4 different versions, with the most recent being released at the start of 2019. This updated version maintains a strong focus on automating processes in order to maximise professional time and the business integration of IT departments, in order to improve communication between teams and technical and non-technical staff. Version 4 features new ways to tackle the challenges of modern technology and its main goal is to become ever more agile and cooperative.

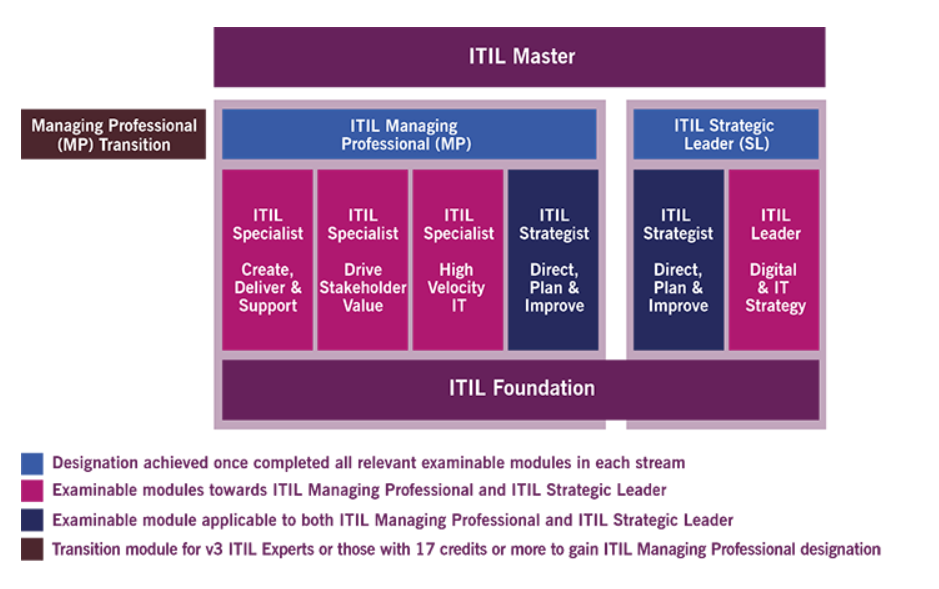
Reading current books on the subject simply won’t give you enough background to effectively implement ITIL for your company, however. You need to engage professionals dedicated specifically to the field, and guarantee adequate training and certifications for both the company and these professionals. Current certification, in accordance with the 4th version of ITIL, is divided into two levels: ITIL Foundation and ITIL Master – each one with its own unique examinations and programme content. There are two options under the ITIL Foundation module: ITIL Managing Professional (which certifies an ITIL specialist), and the ITIL Strategic Leaders certification (encompassing both ITIL Strategist and ITIL Leader certificates). After completing foundation accreditation, you can then leap into master level – the highest certification available in ITIL 4. You can review the full scheme using the table below:

ITIL

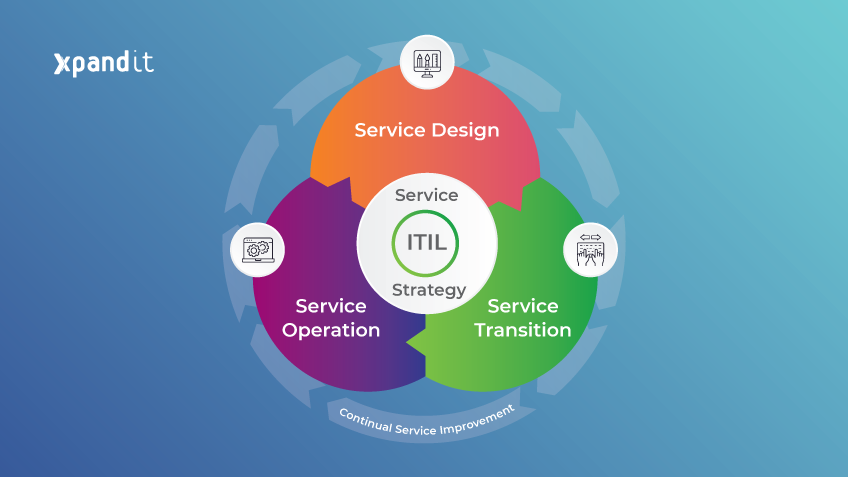
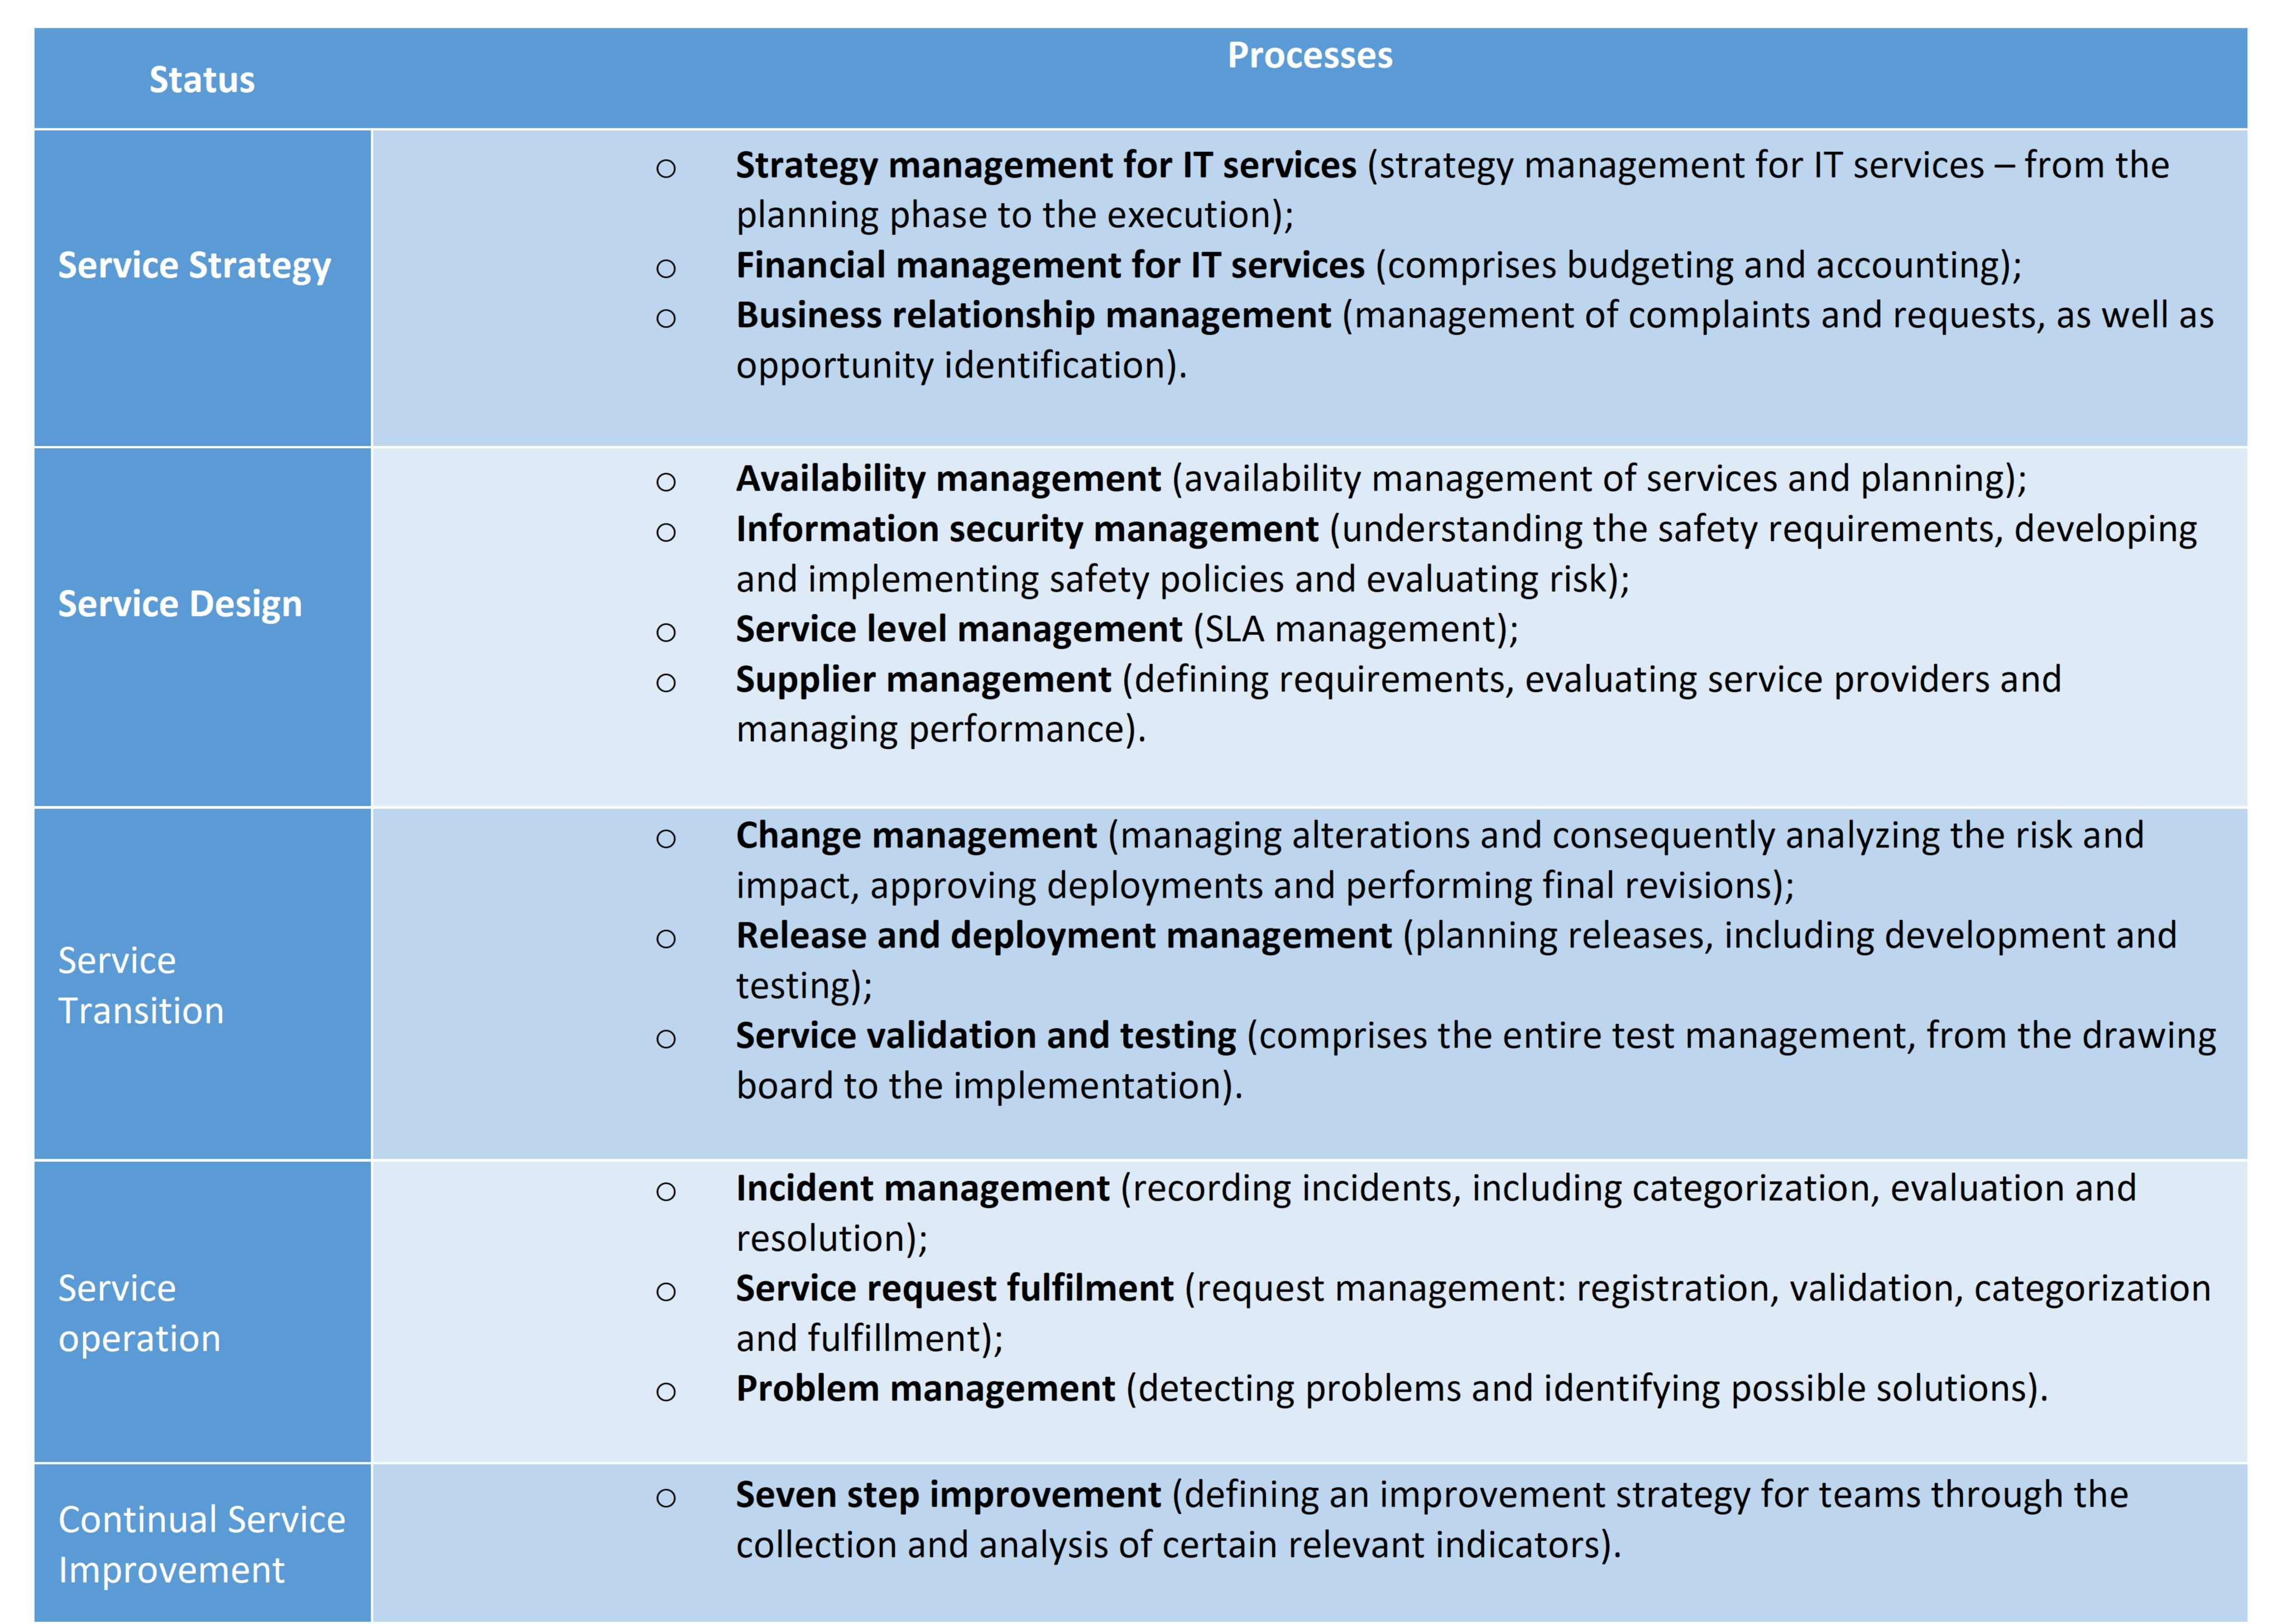
ITIL is divided into five major areas – Service Strategy, Service Design, Service Transition, Service Operations and Continual Service Improvement – and each area has individual processes. Although this framework provides 26 processes in total, companies are not obligated to adopt them in their entirety. It is up to the IT professionals and ultimately the CTO to define appropriate procedures to integrate into teams. Below you can find some examples of the most commonly used processes:

ITIL
Ana LamelasITIL: sound practices to improve your IT service management
read more

Web content management

What is it for, what the advantages are, and what technologies are currently trending

A web content management system (WCMS) is the term used to describe a CMS (content management system), which is a set of tools for managing digital information stored on a website that also allows the user to create and manage content without any knowledge of programming or markup languages such as XML. WCMS is a program that helps users to maintain, control, change and adjust the content on a webpage.

WCMS behaves similarly to a traditional content management system – managing the integrity, editing and information lifecycle – but is specifically designed for handling web content.

The typical functionality of a WCMS system might include the ability to create and store personalised content on the website, with editors being able to review and approve content before it is published and configure an automated publication process. There is an increasingly greater need for such platforms to provide both creative options and accessibility, not just for content, but covering the entire user experience – solutions that manage the uploaded content and facilitate the monitoring of the entire user journey – regardless of the channel being used.

Pros and cons

There are several elements to consider when using a WCMS.

On the one hand, WCMS platforms are usually inexpensive and intuitive to use, as they don’t require technical programming expertise in order to manage and create content. The WCMS workflow can also be personalised by creating several accounts to manage different profiles.

On the other hand, WCMS implementations can sometimes be extremely costly, demanding specific training or certification. Maintenance can also incur extra expense, for licensing upgrades or updates. Security can also be a concern, given that in the event of a safety threat, hackers might explore vulnerabilities which could potentially damage user perceptions of the brand.

Choosing the right WCMS solution

With a WCMS, the content is predominantly stored in a database and grouped using the help of a flexible language such as XML or .Net.

There are several options using open-source WCMS, such as WordPress, Drupal and Joomla for more generic functions. But there are also solutions that cater to specific needs, such as, for example, the Marketing 360 platform, Filestack and CleanPix.

And there are the commercial solutions currently on the market, such as Sitecore, a single platform that comprises several WCMS components, Content Personalization, Content Marketing, Digital Asset Management and E-Commerce. This is one of the major advantages of this platform, as instead of acquiring and integrating the different components that will consume content and information from an adjacent system, in Sitecore’s case, contact data and information and interactions performed through the different channels are already available in the platform, ready to be used and processed by different functions and for different purposes: creating campaigns, sending emails, creating marketing workflows and customisation rules, among others.

WCMS solutions provide different functionalities, with several levels of depth and specific purposes. Before selecting the platform, consider the following functionalities:

  • Configuration: ability to activate and deactivate functionality using specific parameters.
  • Access management: managing users, permissions and groups.
  • Extension: the capacity to install and configure new functionalities and/or connectors.
  • The ability to install models with new functionalities
  • Customisation: ability to change specifications to customise some features, through toolkits or interfaces.
  • WYSIWYG: capacity to provide a “What you see is what you get” mechanism, allowing content managers to know, while making alterations, what the users will see after launching a new version of the content. A good example of this is provided on Sitecore’s “Experience Editor”
  • Integration: ability to integrate the WCM solution with other previously installed solutions, or with external solutions in order to gather information from both ends; for example, integration with Microsoft CRM Dynamics 365 or Microsoft SharePoint.
  • Flows: capacity to incorporate a flow configuration mechanism for content approval and alteration, from different content creators with different profiles, plus content publishing.
  • User experience: editing is less complex, with built-in templates that add a predetermined functionality to the page, with no additional training needed.
  • Technical assistance and updates: consider the degree of technical support you will receive, as well as the level of accessibility for making system updates.

The advantages of WCMS

A major advantage of WCMS is the fact that the software solution gives you consistent control over the look and feel of the website – brand, wire frames, navigation – simultaneously granting the functionality to create, edit and publish content – articles, photo galleries, video, etc. WCMS can be the best solution for companies looking for a rich content repository, focused on brand consistency.

Other advantages:

  • Automated templates;
  • Controlled access to the page;
  • Scalability;
  • Tools that allow simple editing, via WYSIWYG solutions;
  • Regular software updates;
  • Workflow management;
  • Collaboration tools that provides users with permission to modify the content;
  • Document management;
  • Ability to publish content in several languages;
  • Ability to retrieve older editions;
  • Ability to analyse content across devices (desktop, mobile, tablet, watch).
  • Omnichannel content availability.

Our vision

Content management is a relevant topic, although not recent. However, a topic that gained a lot of traction during recent years is the capacity to use customised content, offering a relevant experience to all users. In order to achieve this goal, Xpand IT decided to go into partnership with Sitecore, because we believe it to be the best platform for addressing customisation challenges, benefiting from the aforementioned advantages and also exploiting the fact that Sitecore allows Headless implementations (separating the entire content from the presentation layer), as well as integration with mobile platforms (producing true omnichannel solutions). We are certain that this technology has a lot to offer and we are excitedly looking forward to implementing new functionalities, which will be available soon and launched with the intent of fulfilling our vision – offering relevant and personalised content for everyone, at any time, in any place.

Sílvia RaposoWeb content management
read more

Xpand IT enters the FT1000 ranking: Europe’s Fastest Growing Companies

Xpand IT proudly announces our entry into the Europe’s Fastest Growing Companies ranking, compiled by renowned international journal the Financial Times! With sustained growth surpassing 45% in 2018, Xpand IT attained a place among the fastest growing companies, along with 1000 other European enterprises, taking into account their consolidated results between 2014 and 2017.

An income of 10 million and 195 collaborators were the figures that guaranteed our place on this list. Our income has since taken the leap to 15 million, and we can now count on the tireless work of more than 245 collaborators. And so, out of the three Portuguese tech companies distinguished with a spot on the ranking, Xpand IT can boast the best results in terms of income and the acquisition of new talent.

Paulo Lopes, CEO & Senior Partner of Xpand IT, said “Having a place on the FT 1000 European ranking is the ultimate recognition for all the work we have undertaken over the last few years.  We are renowned for our know-how and expertise within the technology arena, and now also for our unique team and business culture, focused on excellency and innovation, which makes it far easier to achieve these kinds of results.”

This year’s goal is to maintain our growth trend, not just by expanding into new markets, but also by increasing our workforce. In 2019, we expect to reach the beautifully rounded number of 300 Xpanders!

Sílvia RaposoXpand IT enters the FT1000 ranking: Europe’s Fastest Growing Companies
read more

7 steps to implement a data science project

Data science is a set of methods and procedures applied to a very complex, concrete problem, in order to solve it. It can use data interference, algorithm development and technology to analyse collected data and understand certain phenomena, identifying patterns. Data scientists must be in possession of mathematical and technological knowledge, along with the right mindset to achieve the expected results.

Through the unification of various concepts, such as statistics, data analysis and machine learning, the main objective is to unravel behaviours, tendencies or interferences in specific data that would be impossible to identify via a simple analysis. The discovery of valuable insights will allow companies to make better business decisions and leverage important investments.

In this blog post, we unveil 7 important steps to facilitate the implementation of data science.

1. Defining the topic of interest / business pain-points

In order to initiate a data science project, it is vital for the company to understand what they are trying to discover. What is the problem presented to the company or what kind of objectives does the company seek to achieve? How much time can the company allocate to working on  this project? How should success be measured?

For example, Netflix uses advanced data analysis techniques to discover viewing patterns from their clients, in order to make more adequate decisions regarding what shows to offer next; meanwhile, Google uses data science algorithms to optimise the placement and demonstration of banners on display, whether for advertisement or re-targeting.

2. Obtaining the necessary data

After defining the topic of interest, the focus shifts to the collection of fundamental data to elaborate the project, sourced from available databases. There are innumerable data sources, and while the most common are relational databases, there are also various semi-structured sources of data. Another way to collect the necessary data revolves around establishing adequate connections to web APIs or collecting data directly from relevant websites with the potential for future analysis (web scrapping).

3. “Polishing” the collected data

This is the next step – and the one that comes across as more natural – because after extracting the data from their original sources, we need to filter it. This process is absolutely essential, as the analysis of data without any reference can lead to distorted results.

In some cases, the modification of data and columns will be necessary in order to confirm that no variables are missing. Therefore, one of the most important steps to consider is the combination of information originating from various sources, establishing an adequate foundation to work on, and creating an efficient workflow.

It is also extremely convenient for data scientists to possess experience and know-how in certain tools, such as Python or R, which allow them to “polish” data much more efficiently.

4. Exploring the data

When the extracted data is ready and “polished”, we can proceed with its analysis. Each data source has different characteristics, implying equally different treatments. At this point, it is crucial to create descriptive statistics and test several hypotheses – significant variables.

After testing some variables, the next step will be to transfer the obtained data into data visualisation software, in order to unveil any pattern or tendency. It is at this stage that we can include the implementation of artificial intelligence and machine learning.

5. Creating advanced analytical models

This is where the collected data is modelled, treated and analysed. It is the ideal moment to create models in order to, for example, predict future results. Basically, it is during this stage that data scientists use regression formulas and algorithms to generate predictive models and foresee values and future patterns, in order to generalise occurrences and improve the efficiency of decisions.

6. Interpreting data / gathering insights

We are nearly entering the last level for implementing a data science project. In this phase, it is necessary to interpret the defined models and discover important business insights – finding generalisations to apply to future data – and respond to or address all the questions asked at the beginning of the project.

Specifically, the purpose of a project like this is to find patterns that can help companies in their decision-making processes: whether to avoid a certain detrimental outcome or repeat actions that have reproduced manifestly positive results in the past.

7. Communicating the results

Presentation is also extremely important, as project results should be clearly outlined for the convenience of stakeholders (who, in the vast majority of instances, are without technical knowledge). The data scientist has to possess the “gift” of storytelling so that the entire process makes sense, meeting the necessary requirements to solve the company’s problem.

If you want to know more about data science projects or if you’d like a bit of advice, don’t hesitate to get in touch.

Sílvia Raposo7 steps to implement a data science project
read more